Most teams track GEO performance the same way they track SEO — by checking Google Analytics and Search Console at the end of the month and looking for traffic changes. That approach misses most of what matters for GEO. AI Overview impressions, Perplexity referral traffic, and citation frequency across platforms are not visible in a standard SEO report. A dedicated GEO metrics dashboard pulls all of those signals into one place — so you can see whether your GEO strategy is producing results, which pages are earning AI visibility, and where the gaps are before they become traffic losses. Building it in Looker Studio takes about two hours and costs nothing.
Why GEO Needs Its Own Dashboard — Not a Shared SEO Report
A standard SEO dashboard hides GEO performance inside aggregated metrics that make AI visibility invisible.
Google Search Console blends AI Overview impressions with organic impressions by default. Google Analytics groups Perplexity referral traffic with all other referral sources. Without deliberate separation, GEO performance disappears into the noise of your existing SEO reporting.
The result is that teams have no idea whether their GEO strategy is gaining traction or stalling. They see aggregate traffic numbers. They cannot see whether those numbers include AI citation visits or not. They cannot see whether AI Overview impressions are growing or declining. They cannot see which platforms are citing them and which are not.
A dedicated GEO dashboard solves this by isolating the signals that matter for AI visibility. AI Overview impressions tracked separately from organic. Perplexity, ChatGPT, and Gemini referral traffic tracked separately from other referral sources. Manual citation data brought into the same view as automated metrics.
For teams still building their citation monitoring process before building a dashboard, our guide on how to track AI citations for free covers the manual workflow that feeds the data this dashboard needs.
💡 Pro-Tip: Before building the dashboard, set up your GSC property with AI Overview as a separate saved filter. Do the same in GA4 — create a custom segment for referral traffic from perplexity.ai, chat.openai.com, and gemini.google.com. Setting these up once means every future report pulls the right data automatically without manual filtering each time.
The Key GEO Metrics to Track and What Each One Tells You
A GEO dashboard needs five core metrics: AI Overview impressions, AI Overview CTR, AI Overview clicks, AI platform referral traffic, and manual citation presence by platform.
AI Overview impressions are your primary GEO visibility metric. Growth means your content is entering more AI Overview slots. A drop means content has been displaced — usually by a competitor publishing fresher or better-structured content on the same topic.
AI Overview CTR tells you how often users click through from those impressions. According to BrightEdge’s 2025 research, AI Overview CTR averages 0.8% — significantly lower than standard organic CTR of 3 to 5%. A page with CTR well below that average has a title or meta description problem, not a content problem.
AI platform referral traffic in GA4 is the closest proxy for non-Google AI citation performance. When Perplexity cites your content and a user clicks the source link, that visit appears as referral traffic from perplexity.ai in GA4. Tracking this separately from other referral sources shows whether AI citation visibility is translating into actual site visits.
Manual citation presence data — from your weekly Perplexity, ChatGPT, and Gemini checks — provides the platform-level granularity that automated tools cannot yet deliver. Trend data from 90 days of tracking turns individual checks into a performance signal.
GSC Integration: How to Pull AI Overview Data Into Your Dashboard
Google Search Console now separates AI Overview impression data from organic data — and connecting it to Looker Studio takes under ten minutes.
Open Looker Studio and create a new report. Add Google Search Console as a data source using the built-in connector. Select your verified property and authorise the connection.
The critical step is the search type filter. Apply “search type: AI Overviews” to every GSC widget in your GEO dashboard. Without this filter, AI Overview data blends with organic data and the GEO signal disappears completely. With it, every metric reflects only AI Overview performance.
Add three core GSC widgets. First, a scorecard showing total AI Overview impressions with a comparison period. Second, a 90-day impressions trend line — this is where growth or decline becomes visible. Third, a table of top pages by AI impressions with CTR and clicks as secondary columns.
One important limitation: GSC AI Overview data has a two to three day reporting delay. Set your dashboard date range to end three days before today. Otherwise your most recent data points show artificially low numbers that normalise as the delay clears.
💡 Pro-Tip: Add a second GSC data source to the same report — connected to the same property but without the AI Overview filter. Place organic data widgets alongside AI Overview widgets. The side-by-side view makes it immediately visible when a page gains AI impressions but loses organic clicks — that divergence pattern is one of the most useful signals for prioritising content updates.
API Connections and Referral Traffic from AI Platforms
GA4 referral traffic from AI platforms is the most underused GEO metric available — and setting it up takes five minutes in Looker Studio.
Connect Google Analytics 4 as a second data source. Add a table showing sessions by session source. Filter for three specific domains: perplexity.ai, chat.openai.com, and gemini.google.com.
For each source, track four metrics: sessions, engagement rate, pages per session, and conversions. This shows not just whether AI-cited users are visiting — but whether they are engaging and converting once they arrive.
The numbers will be small compared to organic traffic for most sites. That is expected. But the quality of AI referral traffic is often higher than other referral sources. Users clicking through from a Perplexity citation already know your brand from the response context — they arrive with more pre-built familiarity than a cold organic visit.
For teams ready to go deeper — including RAG system analysis and AI query clustering — our guide on advanced GEO analytics covers the measurement frameworks that connect AI-attributed traffic to content performance at the query cluster level.
Dashboard Build: Putting It All Together in Looker Studio
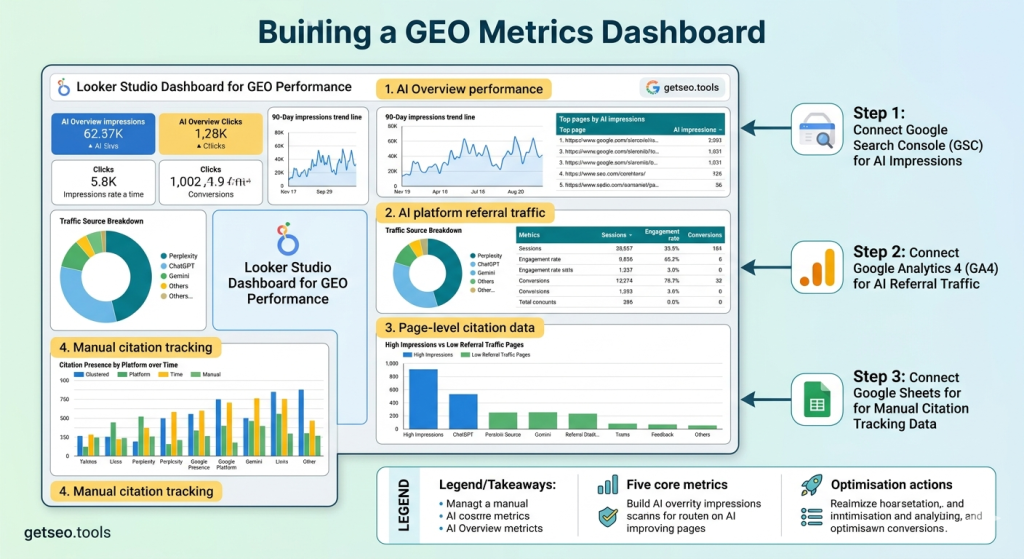
A complete GEO metrics dashboard has four sections: AI Overview performance, AI platform referral traffic, page-level citation data, and manual citation tracking.
Section one — AI Overview performance. Three widgets at the top: total impressions scorecard, 90-day trend line, top pages by AI impressions table. All filtered by search type: AI Overviews from GSC. This section answers: how visible are we in Google’s AI features, and is that growing?
Section two — AI platform referral traffic. Sessions breakdown table filtered for Perplexity, ChatGPT, and Gemini referral sources from GA4. Add engagement rate and conversions as secondary metrics. This section answers: are AI citations actually driving people to our site?
Section three — page-level citation data. A table combining GSC AI impressions alongside GA4 AI referral traffic per page. Pages with high impressions but zero referral traffic have a CTR problem — the citation slot is won but not clicked. Pages with referral traffic but low impressions are earning Perplexity or ChatGPT citations that GSC does not capture. Both patterns point to different optimisation actions.
Section four — manual citation tracking. A bar chart connected to your Google Sheet of weekly citation results — citation presence by platform over time. This is the qualitative layer that contextualises everything above it.
According to Semrush’s 2025 GEO reporting research, teams with a dedicated GEO dashboard identified citation performance issues an average of five weeks earlier than teams relying on standard SEO reports. That five-week window is the difference between catching a content gap before it costs citation share and discovering it after a competitor has already taken the slot.
GEO Metrics: What Each Data Source Measures
| Data Source | Metric | What It Measures | Update Frequency | GEO Use |
|---|---|---|---|---|
| Google Search Console | AI Overview Impressions | How often your pages appear in Google AI Overviews | Daily (2–3 day delay) | Primary GEO visibility metric |
| Google Search Console | AI Overview CTR | Click rate from AI Overview appearances | Daily (2–3 day delay) | Title and meta description optimisation signal |
| Google Analytics 4 | Referral from perplexity.ai | Sessions driven by Perplexity citation clicks | Real-time | Perplexity citation conversion proxy |
| Google Analytics 4 | Referral from chat.openai.com | Sessions driven by ChatGPT citation clicks | Real-time | ChatGPT citation conversion proxy |
| Google Analytics 4 | Referral from gemini.google.com | Sessions driven by Gemini citation clicks | Real-time | Gemini citation conversion proxy |
| Google Sheets (manual) | Citation presence by platform | Whether content is cited on Perplexity, ChatGPT, Gemini per query | Weekly manual update | Cross-platform citation trend tracking |
Frequently Asked Questions
What metrics should a GEO dashboard track?
A GEO dashboard should track AI Overview impressions, AI Overview CTR, and AI Overview clicks from Google Search Console, referral traffic from Perplexity and ChatGPT in Google Analytics, and manual citation presence across platforms. Together these metrics show both visibility and whether that visibility is driving actual site visits.
Can I build a GEO dashboard in Looker Studio for free?
Yes. Google Looker Studio is free. The GSC connector, Google Analytics connector, and Google Sheets connector are all free. You can build a complete GEO performance dashboard at no cost — the only requirement is that your GSC property is verified and your GA4 is tracking site traffic correctly.
Does Google Search Console show Perplexity citation data?
No. Google Search Console only tracks Google AI Overview impressions — not Perplexity or ChatGPT citations. Perplexity referral traffic appears in Google Analytics as referral traffic from perplexity.ai. ChatGPT referral traffic appears from chat.openai.com. These GA4 referral sources are the closest proxy for non-Google AI citation performance.
How do I separate AI Overview impressions from organic impressions in GSC?
In Google Search Console, go to the Search Results performance report. Click the Search type filter and select AI Overviews. This filters all impression, click, CTR, and position data to show only AI Overview appearances — completely separate from standard organic search results.
How often should I review my GEO metrics dashboard?
Review your GEO dashboard weekly for top-line metrics — AI Overview impressions and referral traffic from AI platforms. Do a deeper monthly review that includes the citation tracking sheet and page-level AI CTR data. Weekly reviews catch sudden drops early. Monthly reviews identify longer-term trends that require content or schema updates.
Key Takeaways
- A standard SEO dashboard hides GEO performance — AI Overview impressions blend with organic impressions and Perplexity referral traffic disappears into general referral data without deliberate separation.
- Five core metrics power a GEO dashboard: AI Overview impressions, AI Overview CTR, AI Overview clicks, AI platform referral traffic from GA4, and manual citation presence by platform.
- GSC AI Overview data requires a search type filter — without filtering by AI Overviews specifically, every GSC metric in your dashboard blends GEO and organic data together.
- GA4 referral traffic from perplexity.ai and chat.openai.com is the best free proxy for non-Google AI citation performance — small in volume but high in engagement quality.
- Looker Studio is completely free — GSC, GA4, and Google Sheets connectors all cost nothing. A complete GEO dashboard can be built in under two hours.
- Teams with a dedicated GEO dashboard identify citation issues five weeks earlier than teams using standard SEO reports — giving them time to respond before competitors capture the citation slot permanently.
- The four-section dashboard structure — AI Overview performance, AI referral traffic, page-level citation data, manual citation tracking — covers every GEO visibility signal in one place.