
We deployed comprehensive Product schema across an outdoor equipment retailer’s 6,200 SKUs in late March. By mid-May, organic CTR from product-related queries had increased 31% despite ranking positions remaining virtually unchanged. The traffic lift translated to $127,000 in additional monthly revenue attributable directly to enhanced SERP presentation—star ratings, pricing, and availability visible before users ever clicked through. The client’s CFO asked why we hadn’t implemented structured data two years earlier when we first recommended it.
That question reflects the fundamental challenge with schema markup ROI: the benefits are substantial and measurable, but they manifest differently than traditional ranking improvements. Most stakeholders understand “we moved from position 5 to position 3” but struggle to conceptualize “we maintained position 4 but now capture 40% more clicks because our listing displays star ratings while competitors show plain text.”
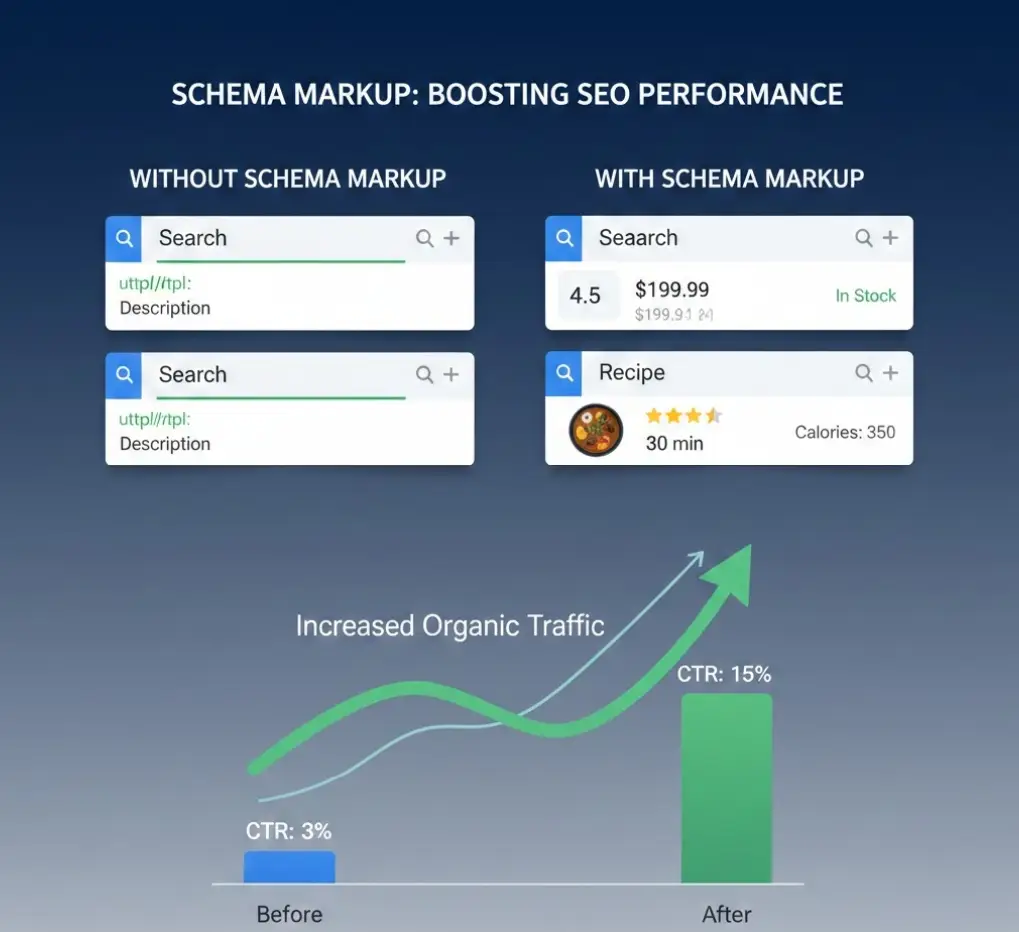
Schema markup SEO benefits operate primarily through SERP presentation dominance rather than ranking manipulation. You’re not climbing higher in results—you’re making your existing positions exponentially more valuable through enhanced visual real estate, trust signals, and information density that competitors lacking structured data simply cannot match. Understanding this distinction shapes realistic ROI expectations and proper measurement frameworks.
The revenue impact compounds over time as enhanced listings build user recognition and trust. Searchers develop pattern association: results with visible ratings, prices, and rich information feel more authoritative. Your plain blue link might rank identically to a competitor’s rich result, but user psychology heavily favors the enhanced presentation. This advantage grows as more users encounter your enhanced listings across multiple searches and query types.
Visibility vs Ranking Reality
Traditional SEO focuses intensely on ranking position as the primary success metric. Position 1 beats position 2, which beats position 3, following a predictable CTR decay curve. This ranking-centric worldview treats SERP presentation as constant—every result at position 4 performs identically regardless of how it displays.
Structured data fundamentally breaks this assumption. Two listings at identical ranking positions can have dramatically different CTR based on enhancement presence and quality. The position 5 result with star ratings, review count, pricing, and availability information often outperforms the position 3 plain listing lacking these elements.
User perception shifts when rich results populate SERPs. Enhanced listings signal authority, recency, and trustworthiness through visual cues processed subconsciously. Star ratings create social proof. Visible pricing reduces uncertainty. FAQ expansions demonstrate comprehensive content. Breadcrumb trails show site structure clarity. Each element builds perceived credibility before users read your title or description.
The psychology operates at attention and decision layers simultaneously. Rich results capture attention through visual differentiation in otherwise text-heavy SERPs. They also reduce decision friction by answering key questions—price, availability, quality ratings—directly in search results. Users can evaluate fit before clicking, increasing qualified traffic while filtering mismatched intent.
Click behavior studies consistently demonstrate this effect across verticals. E-commerce queries show 15-40% CTR increases when product rich results display. Local searches with map pack enhancements see 25-50% lifts. Recipe results with images, cook times, and ratings dominate clicks even from lower positions. The magnitude varies by query type and competitive context, but the directional effect remains consistent.
This creates scenarios where ranking improvements deliver minimal value if you already have rich results. Moving from position 4 to position 3 might increase CTR by 2-3% when your enhanced listing already captures most available clicks at position 4. Meanwhile, maintaining position 4 but adding rich results that competitors lack could boost CTR by 25%. The enhancement deployment delivers 8-10x more impact than the ranking improvement.
Strategic implications favor schema implementation before pursuing difficult ranking gains in mature competitive landscapes. If you rank positions 3-7 for valuable queries, adding comprehensive schema coverage probably delivers more traffic than expensive link building campaigns attempting to reach position 1. The enhancement advantage compounds across every query where you rank on page one, not just the handful where you achieve top positions.
CTR Lift Quantification
Measuring schema’s CTR impact requires isolating enhancement effects from ranking changes, seasonal patterns, and external factors that influence click behavior simultaneously.
E-commerce Product Results
Product schema demonstrates the most straightforward measurement opportunity because implementation timing is controllable and results are unambiguous. Before deployment, product pages rank at various positions without enhanced SERP features. After deployment, the same URLs at the same positions display star ratings, pricing, and availability.
Baseline CTR by position before schema implementation establishes the control group. Track position-specific CTR for 4-8 weeks across all product queries in Search Console. Calculate average CTR for positions 1-3, positions 4-6, and positions 7-10 separately since position dramatically affects baseline rates.
Deploy schema and allow 2-3 weeks for Google to crawl, validate, and begin displaying enhancements. Monitor enhancement coverage in Search Console’s Product reports—what percentage of product URLs now show valid schema and earn rich results. As coverage increases, segment CTR data comparing enhanced versus non-enhanced URLs at identical positions.
Realistic lift ranges from 15-35% for products with strong review signals and competitive pricing. A product ranking position 5 with 3.2% baseline CTR might achieve 4.1-4.3% CTR after rich results appear—a 28-34% relative increase. Lower-quality products with poor ratings might see smaller lifts or even CTR decreases if visible ratings discourage clicks by revealing low scores.
The measurement becomes cleaner when you control rollout timing. Deploy schema to 50% of products randomly selected, leaving the other 50% as a control group. Both groups rank at similar positions and receive similar traffic, but only the schema group displays enhancements. The CTR delta between groups isolates schema impact from confounding variables.
Local Business Visibility
Local search results present more complex measurement because schema interacts with Google Business Profile data, map pack placement, and local pack algorithms differently than organic results. LocalBusiness schema primarily reinforces entity verification and data consistency rather than directly creating rich result displays like product schema does.
The ROI manifests through map pack eligibility improvements and knowledge panel triggers rather than organic result enhancements. Businesses with comprehensive LocalBusiness schema often see increased map pack appearances for location-modified queries—searches including city names, “near me” modifiers, or implicit local intent.
Track map pack impression share and position distribution before and after LocalBusiness schema deployment. Use local rank tracking tools segmenting visibility by pack position since position 1 in the 3-pack dramatically outperforms positions 2-3. Improvement from 30% map pack presence to 55% presence represents substantial visibility and traffic growth even without organic ranking changes.
Knowledge panel triggers provide another measurement dimension. Branded searches that previously showed standard organic results might begin displaying knowledge panels with business information, hours, reviews, and direct actions after proper Organization and LocalBusiness schema implementation combined with strong entity signals. Track branded query SERP features to measure this enhancement category.
For detailed schema implementation guidance ensuring local markup follows best practices that maximize these visibility improvements, see our comprehensive guide on schema markup for local SEO.
Informational Content Enhancements
Article, FAQ, and HowTo schema create different enhancement types with varying visibility impacts. FAQ schema can expand in SERPs showing multiple questions and answers, claiming significant vertical space. HowTo schema displays step lists with images. Article schema enables top stories carousels and publication date prominence.
Measuring these requires query-level segmentation. Identify informational queries where you rank well—positions 1-5—and track what percentage display enhanced features. Not every eligible query triggers FAQ expansions or HowTo displays because Google’s algorithms determine enhancement appropriateness contextually.
When enhancements do appear, the impact can be dramatic. A position 3 result with FAQ expansion showing three questions might claim more screen real estate than the position 1 and 2 results combined, capturing disproportionate attention and clicks. The effect is especially pronounced on mobile where expanded FAQs push other results below the fold.
The challenge is variability—the same URL with identical schema might show enhancements for some queries but not others based on Google’s interpretation of query intent and result relevance. Track enhancement display rates across query portfolios rather than assuming universal coverage. Your FAQ schema might be perfectly valid but Google chooses to display it on only 40% of relevant queries.
CTR lift estimates for informational enhancements range from 10-25% when they appear, but you must account for display frequency. If enhancements show 40% of the time with 20% CTR lift when present, the blended impact is approximately 8% across the full query set. This nuance matters for accurate ROI modeling.
Revenue Impact Modeling
Translating CTR improvements into revenue projections requires realistic assumptions about conversion rates, average order values, and customer lifetime value. The modeling framework connects SERP visibility changes to business outcomes through probability chains.
Start with impression volume from Search Console for query segments where schema implementation has occurred or will occur. Product queries, local queries, informational queries each have baseline impression volumes representing demand. Not all impressions occur at positions where you’re visible—filter to impressions where you rank on page one since schema primarily affects already-visible results.
Apply current CTR by position to calculate baseline clicks. Position 3 at 7% CTR with 10,000 monthly impressions generates 700 clicks. Position 7 at 2% CTR with 5,000 impressions generates 100 clicks. Sum across positions and queries to establish total baseline traffic.
Model the enhancement effect by applying realistic CTR lift percentages to positions where schema will improve presentation. Conservative estimates use the lower bound of observed ranges—15% for products, 10% for informational, 20% for local. Aggressive estimates use upper bounds—35% for products, 25% for informational, 50% for local. Most modeling should use midpoint estimates with sensitivity analysis showing ranges.
If your 700 monthly clicks from position 3 product results increase by 25% through rich result deployment, that’s 175 additional clicks monthly. Your 100 clicks from position 7 FAQ results might increase by 15%, adding 15 clicks. Aggregate incremental clicks across all affected positions and queries.
Conversion rate assumptions determine revenue impact. E-commerce typically sees 2-4% conversion rates from organic search traffic. Higher-intent product queries might convert at 5-8%. Service businesses might convert at 3-6%. Use your actual conversion data if available or industry benchmarks if not.
The 175 additional product clicks at 4% conversion generate 7 additional transactions monthly. At $150 average order value, that’s $1,050 in incremental monthly revenue from one query at one position. Scale across all affected queries and positions to project total impact.
Account for margin and customer lifetime value to calculate true business impact. If your gross margin is 40%, the $1,050 in revenue represents $420 in contribution margin. If customers return with 30% probability over 12 months, the lifetime value multiplier is approximately 1.4x, bringing customer value to $1,470 per cohort or $588 in margin.
The modeling reveals whether implementation investment generates positive ROI. If schema deployment costs $15,000 in development and you’re projecting $8,000 in monthly incremental margin, payback occurs in less than two months with ongoing returns thereafter. The investment clearly makes sense. If projected impact is only $800 monthly, payback takes 19 months and the decision becomes more marginal depending on other priorities.
Sensitivity analysis tests how results change with different assumptions. Run scenarios with conservative CTR lifts, pessimistic conversion rates, and lower average order values. If ROI remains positive even in pessimistic scenarios, implementation is robust. If positive ROI depends on optimistic assumptions, the decision carries more risk.
Entity Authority Effects
Beyond direct CTR improvements, structured data influences how search algorithms understand and categorize your site within their knowledge architecture. These entity-level effects compound over time as systems build confidence in your topical authority and content relationships.
Knowledge graph alignment occurs when your schema declarations match Google’s entity database records. If you publish Organization schema claiming your company’s founding date, headquarters location, and key executives that precisely matches Google’s knowledge graph data about your entity, you reinforce their existing understanding. Consistency across signals builds algorithmic trust.
The trust manifests in entity-related query treatments. Searches for your brand name, products, or services associated with your entity become more likely to trigger knowledge panels, direct answer features, and entity-specific rich results. Your content gets preferential treatment for queries where Google’s algorithms determine your entity has particular relevance or authority.
This advantage is subtle and difficult to measure directly but observable through pattern analysis. Businesses with comprehensive entity-level schema—Organization, sameAs properties linking social profiles, proper brand and subsidiary relationships—tend to maintain stronger visibility for branded and near-branded queries compared to competitors with identical backlink profiles and content quality but minimal structured data.
Semantic trust signals emerge from schema revealing content structure and topical relationships. When your article schema consistently includes relevant keywords in headline properties, declares appropriate authors with expertise markers, and connects to related content through mainEntity and about properties, search systems learn to trust your content categorization.
Pages declaring themselves as HowTo guides through schema should actually provide step-by-step instructional content. Products declaring specific categories should match those categories in your site navigation and content. The alignment between schema declarations and actual content structure tells algorithms your structured data is accurate rather than manipulative markup attempting to game systems.
Sites with accurate, comprehensive schema that consistently matches content reality build semantic trust over time. Future content from trusted entities might receive faster indexing, more generous interpretation of quality signals, and better topical categorization. The compounding effect is hard to isolate but contributes to overall organic performance.
Indexing clarity improves when structured data explicitly declares content relationships, hierarchies, and categorization that algorithms might otherwise infer imperfectly from unstructured signals. Breadcrumb schema shows exact navigation paths. ItemList schema declares ordered relationships. Collection schema groups related content. Each helps search systems understand your information architecture correctly.
For sites managing complex content taxonomies across multiple categories and topics, our Topic Cluster Tool helps organize which schema types reinforce which topical relationships, ensuring your structured data architecture supports rather than contradicts your content strategy.
Competitive Advantage Window
Schema adoption follows a predictable diffusion curve within verticals. Early adopters gain disproportionate advantage when they’re the only results displaying enhancements. As adoption increases, enhancement advantage erodes into hygiene factor—having schema maintains parity rather than creating differentiation.
Strategic timing matters significantly for ROI maximization. Deploying comprehensive schema when 10-20% of competitors have it yet 80-90% don’t creates maximum visibility differential. Your enhanced results dominate SERPs full of plain listings, capturing outsized click share relative to ranking positions.
The advantage window narrows as adoption increases. When 60-70% of competitors have rich results, your schema deployment maintains competitiveness rather than creating advantage. You must implement to avoid disadvantage, but the incremental gain over not implementing exceeds the gain from implementing.
Check competitive schema coverage by examining SERPs for your target queries. What percentage of results display rich features—star ratings, pricing, FAQs, breadcrumbs? If fewer than 30% show enhancements, you’re in early advantage territory. If more than 60% show enhancements, you’re implementing for parity. Both justify deployment but with different urgency and expected impact levels.
First-mover advantages in your specific niche might be larger than industry averages suggest. Even if 40% of e-commerce sites broadly have Product schema, the adoption rate in your specific vertical—artisan leather goods, industrial filtration systems, specialty outdoor equipment—might be much lower. Analysis should focus on direct competitors in your niche rather than category averages.
Local businesses often face lower competitive schema adoption than e-commerce, creating persistent advantage windows. Even in 2025, many local service providers lack proper LocalBusiness implementation. The businesses investing in comprehensive structured data maintain visibility advantages over competitors who haven’t prioritized technical optimization.
Monitor adoption trends in your competitive set to gauge window duration. If quarterly reviews show competitors deploying schema at accelerating rates, the advantage window is closing. This information shapes prioritization—implement sooner to capture more of the window rather than waiting until it closes. If competitive adoption remains static, you have more time flexibility though implementing earlier still captures more cumulative benefit.
Monitoring ROI Properly
Measuring ongoing schema ROI requires tracking metrics that connect structured data coverage to business outcomes rather than focusing exclusively on technical validation.
Enhancement coverage tracking monitors what percentage of eligible URLs actually earn rich results in search. Your site might have 10,000 products with valid Product schema but only 7,000 displaying rich results because some lack reviews, others have pricing issues, and a few fall below quality thresholds. The 70% coverage rate represents your effective implementation.
Track coverage trends over time. Increasing coverage indicates improving implementation quality and data completeness. Declining coverage suggests degradation through content changes, platform updates, or algorithm adjustments requiring investigation. Set coverage percentage goals—85% for products, 60% for informational content, 95% for core local pages—based on content quality and data availability.
CTR segmentation separates enhanced from non-enhanced URLs to isolate schema impact. Export Search Console performance data and cross-reference against enhancement coverage reports. Calculate average CTR for URLs showing rich results versus those not displaying enhancements at similar ranking positions.
The segmented analysis answers whether enhancements actually improve CTR or if coverage percentages alone don’t guarantee impact. Sometimes URLs have valid schema and Search Console shows them as enhanced, but Google chooses not to display rich features in actual SERPs due to quality or relevance determinations. The CTR data reveals real display rates versus technical eligibility.
Snippet visibility monitoring tracks what enhancement types appear for priority queries. Use rank tracking tools with SERP feature detection to monitor whether your rankings include star ratings, pricing, FAQ expansions, or other rich elements. Manual spot checks validate automated tracking since SERP features often vary by location, personalization, and device type.
Focus visibility tracking on high-value query clusters where enhancements deliver maximum business impact. Branded product queries, high-volume category terms, and location-specific searches deserve priority monitoring over long-tail informational queries with minimal traffic.
Impression growth attribution attempts to separate schema-driven visibility improvements from ranking changes. When impressions increase for a query set, determine whether you’ve moved up in rankings or if you’re maintaining positions while earning more impressions through enhanced SERP features claiming more attention.
Search Console’s position data helps with this attribution. If your average position remains 4.2 but impressions increase 30%, enhanced visibility at that position likely explains the growth rather than ranking improvements. If position moves from 4.2 to 3.1 while impressions increase 30%, ranking improvement is the primary driver.
For sites planning comprehensive schema deployment across multiple content types, our Schema Markup Generator ensures technical correctness that enables accurate ROI measurement by eliminating implementation quality as a confounding variable in performance analysis.
Comparison Table
| Implementation Level | Expected CTR Impact | Business Effect | Difficulty | Monitoring Need |
|---|---|---|---|---|
| Basic Organization schema only | 0-5% | Minimal, primarily branded query support | Very Low | Monthly manual checks |
| Product schema without reviews | 5-15% | Modest traffic lift, pricing/availability visibility | Low | Weekly Search Console reviews |
| Product schema with reviews + Local schema | 15-30% | Significant traffic and conversion improvements | Medium | Weekly automated tracking |
| Comprehensive multi-schema deployment | 25-40% | Substantial visibility dominance and revenue impact | Medium-High | Daily automated monitoring with alerts |
| Advanced entity graph + dynamic schema | 30-50%+ | Category leadership and entity authority | High | Real-time monitoring with business metric correlation |
The progression from basic to advanced implementation follows a classic optimization curve—early implementations deliver strong returns relative to effort, while advanced implementations require more sophistication for incremental gains. Most businesses achieve optimal ROI in the comprehensive tier covering primary content types thoroughly rather than attempting advanced entity graph implementations with marginal additional impact.
Small sites should start with basic Organization and core content type schema—LocalBusiness for service businesses, Product for e-commerce, Article for publishers. This foundation covers 70-80% of potential impact with 20-30% of possible implementation complexity. Expanding to comprehensive coverage adds the remaining 20-30% impact for 70-80% of the effort.
Enterprise sites managing tens of thousands of URLs often find that reaching 80-85% coverage of eligible content delivers more value than achieving 95% coverage because the marginal 10-15% typically represents edge cases requiring disproportionate effort. Resource allocation should focus on high-traffic content types and queries where enhancements deliver measurable business value.
FAQ
Does schema directly improve rankings or just click-through rates?
Schema operates primarily as a presentation layer affecting how results display rather than a ranking signal determining where they appear. Google has consistently stated that structured data is not a direct ranking factor—valid schema doesn’t boost your position while invalid schema doesn’t demote you. The ranking algorithms evaluate content quality, relevance, authority, and user experience signals largely independent of structured data presence. However, indirect ranking effects may occur through user behavior signals. If your enhanced listing captures more clicks at position 4 than a competitor’s plain listing at position 3, the engagement metrics—click-through rate, time on site, bounce rate—might influence future ranking adjustments through behavior-based algorithms. These indirect effects are real but secondary to the primary CTR and visibility benefits. Focus ROI expectations on capturing more clicks from existing positions rather than ranking improvements. The cases where schema might directly affect rankings involve entity understanding and indexing clarity—proper structured data helping algorithms categorize and understand content correctly could influence rankings for ambiguous or competitive queries where topical relevance is difficult to determine from content alone.
How long before ROI appears after implementing schema markup?
Timeline varies by implementation scope and site authority but generally follows predictable phases. Technical deployment takes days to weeks depending on site size and CMS complexity. After deployment, Google must crawl your updated pages to discover the schema—this happens within days for frequently crawled sites or weeks for lower-authority sites. Validation and processing adds another few days as Google’s systems parse the markup and determine enhancement eligibility. Rich results typically begin appearing 1-3 weeks after deployment for well-crawled sites. Full coverage saturation where most eligible URLs show enhancements takes 4-8 weeks as Google’s systems complete site-wide recrawling. Measurable CTR improvements appear as soon as enhancements display, so you might see traffic lifts within 2-3 weeks of deployment on high-traffic URLs. Revenue impact lags another 1-2 weeks as increased traffic converts through your normal sales cycle. Realistically, expect to measure meaningful ROI within 6-8 weeks of deployment for most implementations, with full impact realization taking 3-4 months. The timeline accelerates for sites with strong crawl frequency and large existing organic traffic where enhancements immediately affect thousands of daily impressions. The timeline extends for newer sites with minimal authority where Google crawls infrequently and enhancement eligibility faces stricter quality thresholds.
Is schema worth implementing for small sites with limited resources?
Absolutely, though implementation should scale to resource availability and traffic volume. Small sites benefit disproportionately from schema because they often compete against larger competitors in local markets or niche categories where enhancement advantages create meaningful differentiation. A local service business implementing LocalBusiness schema properly might be the only result in their area displaying enhanced map pack features, capturing outsized click share from local queries. Small e-commerce sites in specific niches can dominate SERP presentations through Product and Review schema even while ranking below larger general retailers lacking comprehensive structured data. The resource investment required for meaningful coverage is modest—basic Organization and primary content type schema can be implemented in days, not weeks, using our Schema Markup Generator that eliminates most technical complexity. The ongoing maintenance burden is minimal for small sites with stable content that doesn’t change frequently. The ROI calculation is favorable when your organic traffic generates meaningful revenue or lead volume—even small CTR improvements applied to high-value conversion paths justify implementation effort quickly. Small sites should avoid the complexity trap of implementing every possible schema type and focus on core implementations matching their primary content and business model. A local business needs Organization and LocalBusiness schema thoroughly implemented more than FAQ and HowTo markup. An e-commerce site should prioritize Product schema before investing in advanced Article or Video markup. Strategic focus on high-impact implementations delivers strong ROI regardless of site size.
Conclusion
Schema markup ROI manifests through compounding visibility advantages that accumulate over time rather than one-time ranking improvements. Each enhanced listing performing 25% better than it would without structured data creates incremental traffic and revenue. Across hundreds or thousands of queries, the aggregated impact becomes substantial—the difference between growing organic revenue 15% year-over-year versus 40%.
The measurement discipline matters as much as implementation quality. Sites tracking enhancement coverage, CTR segmentation, and revenue attribution understand exactly how structured data contributes to business outcomes. They can justify continued investment in schema maintenance and expansion through demonstrated returns. Sites implementing without measurement operate on faith, unable to defend the investment when competing priorities demand resources.
Treat structured data as strategic infrastructure rather than tactical optimization. Infrastructure investments in site speed, mobile optimization, and technical foundation create lasting advantages that support all future content and optimization efforts. Schema operates similarly—comprehensive coverage improves every piece of content you publish, every product you add, and every query you target without requiring per-page optimization effort.
The competitive dynamics favor early comprehensive implementation. Structured data adoption follows predictable diffusion curves where early movers capture disproportionate advantage while late adopters implement for competitive parity. Position yourself in the advantaged cohort rather than playing catch-up.
Start measurement before implementation by establishing baseline CTR data segmented by position and query type. Deploy schema systematically starting with highest-traffic content types. Monitor enhancement coverage and CTR impact weekly during rollout. Model revenue attribution through conversion funnel analysis. Optimize based on what delivers measurable business impact rather than technical perfection for its own sake. For a complete ongoing optimization cycle, see our schema markup testing and monitoring guide.
For strategic guidance on which schema types and content categories deliver optimal ROI for your specific business model and competitive context, our AI Content Tool helps prioritize implementation efforts on high-value opportunities rather than comprehensive coverage that dilutes resources across low-impact markup.
The sites dominating organic visibility in 2025 and beyond won’t necessarily rank higher—they’ll present better through comprehensive structured data that transforms ranking positions into revenue-generating visibility advantages competitors lacking schema discipline simply cannot match.