
Technical SEO log file analysis is the only method that provides ground-truth visibility into Googlebot’s crawl behavior — unsampled, unlagged, and unfiltered by GSC averaging. Every other data source — crawl stats dashboards, index coverage reports, third-party crawlers — interprets crawl behavior after the fact. Logs record it as it happens. This guide builds the complete log engineering system: extraction, verification, segmentation, waste classification, render-fetch detection, and integration with the broader technical SEO architecture framework.
The upstream architectural decisions that determine what Googlebot crawls — URL generation, parameter governance, internal link topology — are covered in the technical SEO architecture framework. Log analysis is the measurement layer that validates whether those decisions are producing the intended crawl behavior.
Why GSC Crawl Data Is Insufficient for Diagnostic Work
GSC crawl stats provide aggregated daily totals — total requests, average response time, total bytes downloaded. These numbers describe volume, not distribution. They cannot answer which URL types are consuming the most Googlebot requests, which templates have rendering latency problems, or which parameter families are generating crawl waste. For any diagnostic beyond “Googlebot is generally active on this domain,” GSC crawl stats are the starting point, not the answer.
Server logs answer all of those questions because they record every individual request: the exact URL, the timestamp, the HTTP status code returned, the response size in bytes, and the user agent string. No aggregation. No sampling. No 48-hour lag. The diagnostic resolution available from logs compared to GSC crawl stats is the same difference as a per-transaction database export versus a monthly revenue summary.
The operational implication: every crawl budget optimization decision, every rendering latency investigation, and every indexation control validation should begin with log data — not GSC reports. GSC confirms outcomes; logs explain causes.
Log File Extraction and Preparation Protocol
Raw log files are the prerequisite for every diagnostic step that follows. Extraction approach depends on the server environment, but the preparation protocol is consistent regardless of stack.
Log Sources and Format Variants
Apache generates Combined Log Format by default. Each line contains: client IP, timestamp, request method, URL path, HTTP version, status code, response size, referrer, and user agent. Nginx uses a nearly identical structure. Both are parseable with standard command-line tools or Python without additional libraries.
CDN-intercepted traffic requires a separate extraction path. When Cloudflare, Fastly, or CloudFront serves requests at the edge, many Googlebot requests never reach the origin server — they are served from cache. The origin access log therefore undercounts actual Googlebot activity. Accurate log data requires exporting from the CDN’s access log system, not the origin. Cloudflare Enterprise provides Logpush; Fastly provides real-time log streaming; CloudFront delivers logs to S3 on a configurable schedule.
For any analysis window, pull a minimum of 30 days. Shorter windows miss crawl cycle patterns — Googlebot does not crawl every URL on a daily basis, and frequency distributions built on less than 30 days of data produce misleading averages.
Field Extraction and Normalization
The minimum viable field set for technical SEO log file analysis:
- Timestamp: ISO 8601 format, converted to UTC for consistent cross-timezone analysis
- URL path: Normalized — strip trailing slashes, lowercase, decode percent-encoding
- HTTP status code: Raw response code, not CDN-modified codes
- Response size: Bytes; useful for identifying soft-404s returning 200 with near-zero body size
- User agent string: Full string, not truncated
After extraction, immediately strip static asset requests — CSS, JavaScript, images, fonts, favicon. These inflate raw request counts without contributing to indexation analysis. A log file for a large e-commerce site may contain 60–70% static asset requests; removing them before analysis reduces processing overhead and eliminates noise from frequency calculations.
Googlebot Verification and Agent Segmentation
User agent strings are not authenticated. Any crawler, scraper, or bot can set its user agent to “Googlebot/2.1” — and many do. Treating all requests with a Googlebot user agent string as genuine Googlebot activity inflates crawl metrics and misattributes waste to legitimate search infrastructure.
Reverse DNS Verification Protocol
The verification method is documented in Google’s own Search documentation: perform a reverse DNS lookup on the requesting IP address. Legitimate Googlebot requests resolve to hostnames ending in googlebot.com or google.com. Perform a forward DNS lookup on the resolved hostname — it must return the original IP address. Any request that fails this two-step verification is not legitimate Googlebot traffic and must be excluded from analysis.
At scale, running reverse DNS verification on every log entry is computationally expensive. The practical approach: extract all unique IP addresses from the Googlebot user agent segment. Run batch reverse DNS verification against that IP set. Tag each IP as verified or unverified. Apply the tag to the full request dataset — all requests from verified IPs constitute the legitimate Googlebot dataset for analysis.
Agent Segmentation After Verification
After verification, segment the confirmed Googlebot dataset into distinct agent types. Each agent has different crawl behavior and SEO implications:
- Googlebot/2.1: Primary web crawler for organic search indexation. The core dataset for all technical SEO log file analysis.
- Googlebot-Image/1.0: Image crawler. Relevant for image SEO analysis; exclude from organic crawl budget calculations.
- AdsBot-Google: Crawls for ad quality assessment. Follows different crawl rules; must be analyzed separately and never mixed into organic crawl budget metrics.
- Google-InspectionTool: Triggered by GSC URL Inspection requests. High frequency on small URL sets during active debugging; exclude from baseline crawl frequency calculations to avoid artificial inflation.
Mixing agent types in crawl frequency or budget analysis produces incorrect conclusions. AdsBot-Google can crawl landing pages at extremely high frequency without consuming organic crawl budget — treating those requests as organic crawl budget consumption would significantly overestimate total crawl allocation.
Crawl Frequency Distribution Modeling
Crawl frequency distribution is the primary diagnostic output of technical SEO log file analysis. It answers the question that GSC cannot: of all the URLs Googlebot crawled in the analysis window, how frequently was each one visited — and does that distribution reflect architectural intent?
Building the Frequency Model
Group URLs by crawl frequency bucket across the 30-day analysis window:
- Daily: Crawled one or more times per day on average
- Weekly: Crawled at least once per week but less than daily
- Monthly: Crawled at least once in the window but less than weekly
- Once: Crawled exactly once in the 30-day window
- Not crawled: URL exists in sitemap or internal link graph but received zero Googlebot requests
Map each URL in each frequency bucket against its URL type classification: canonical content page, parameter variant, faceted filter combination, paginated archive, soft-404, orphan URL, or infrastructure URL.
The diagnostic output: in a healthy crawl architecture, canonical content pages dominate the daily and weekly buckets. Parameter variants, faceted combinations, and non-indexable URL types should not appear in those buckets at all. Any non-canonical URL type in the daily crawl bucket represents misallocated crawl investment that should be redirected through the interventions defined in the technical SEO crawl budget optimization framework.
Response Time Correlation
Crawl frequency correlates directly with server response time. Extract average response time per URL pattern from log data and cross-reference against frequency bucket assignment. URLs with consistently high response times — above 500ms average — appear in lower frequency buckets than their canonical importance warrants. This is not coincidental: Googlebot throttles crawl rate when response times indicate server load, reducing crawl frequency for slow-responding URL patterns.
The operational fix is CDN caching and server-side performance optimization. However, identifying which URL patterns are slow-responding requires log data — GSC crawl stats report only a global average, not per-URL-pattern breakdowns.
Crawl Waste Classification Framework
Crawl waste is any Googlebot request that consumes crawl allocation without contributing to canonical content indexation. Classifying waste by type is prerequisite to applying the correct remediation — the wrong fix for the wrong waste type produces no improvement and in some cases degrades crawl efficiency further.
Parameter Crawl Waste Detection
Extract all URL paths containing query string parameters from the verified Googlebot dataset. Group by parameter family using regex pattern matching on common parameter strings: ?utm_, ?ref=, ?sort=, ?filter=, ?sid=, ?color=, ?size=. Calculate total request count per parameter family and express as a percentage of total Googlebot requests in the analysis window.
Any parameter family consuming more than 3–5% of total Googlebot requests without producing indexable content is a remediation target. The remediation priority sequence: tracking and session parameters first (zero indexation value, highest canonical damage potential), sorting parameters second, faceted filter combinations third, calibrated by commercial search demand per the classification model in the technical SEO implementation mistakes reference.
Faceted Navigation Surface Detection
Faceted URL detection requires pattern-based segmentation rather than simple parameter matching. Faceted URLs typically follow structured path patterns — /category/brand/color/size/ — rather than query string parameters, though both formats exist depending on the e-commerce platform.
Build regex patterns for each known facet dimension. Extract all Googlebot requests matching those patterns. Calculate facet crawl share as a percentage of total requests. On unoptimized large catalog sites, facet URL requests commonly represent 40–60% of total Googlebot activity — a waste ratio that leaves canonical product and category pages severely underserved in crawl frequency.
The threshold for intervention: any URL type pattern consuming more than 5% of Googlebot requests with zero or near-zero indexation value requires architectural treatment. Log data provides the exact waste volume needed to prioritize engineering effort — a facet pattern consuming 15% of crawl budget justifies significantly more remediation investment than one consuming 2%.
Orphan URL Detection
Orphaned URLs — indexable pages with no internal link pointing to them — are identifiable through log data by cross-referencing against the internal link graph. The detection process:
Extract all URLs crawled by Googlebot in the analysis window. Export all URLs in the internal link graph from a full site crawl (Screaming Frog or Sitebulb). Export all URLs included in the XML sitemap. The set of log-crawled URLs that appears in none of these sources — internal link graph, sitemap, or redirect chain — is the orphan candidate population.
Confirm orphan status by verifying each candidate URL returns a 200 status code with substantive content. URLs returning 404 or 410 are resolved; URLs returning 200 with no inbound links and no sitemap inclusion are structural orphans requiring link injection or removal from the crawl surface. The technical SEO audit orphan detection module provides the systematic cross-reference workflow for large URL populations.
Crawl Share Segmentation Model
The crawl share model translates raw log data into an actionable distribution summary. It quantifies the proportion of Googlebot crawl investment allocated to each URL type and compares the current allocation against target allocation. This single output drives prioritization for all remediation work.
| URL Type | Typical Unoptimized Share | Target Share | Indexable? | Primary Action |
|---|---|---|---|---|
| Canonical product / category pages | 15–25% | 60–70% | Yes | Increase via depth flattening and link reinforcement |
| Faceted navigation combinations | 30–50% | <5% | Partial (by demand) | Classify by search demand; canonicalize or block non-indexable combinations |
| Tracking / analytics parameters | 10–20% | <1% | No | Canonical to clean URL site-wide; block in robots.txt |
| Pagination (deep tail) | 5–15% | <3% | Partial | Noindex or canonical thin paginated tails beyond depth threshold |
| Soft-404 / empty result pages | 5–10% | 0% | No | Return 404/410 or redirect to relevant parent |
| Orphan legacy URLs | 3–8% | 0% | No | Return 410 or disallow in robots.txt |
| Canonical blog / editorial content | 2–5% | 15–25% | Yes | Underserved; requires depth flattening and internal link reinforcement |
Run this model monthly during active optimization. Post-optimization, run quarterly. Any category where allocation remains unchanged despite directive implementation indicates the fix was not applied at the template level — a pattern that commonly surfaces with parameter canonicalization deployed on individual URLs rather than template-wide.
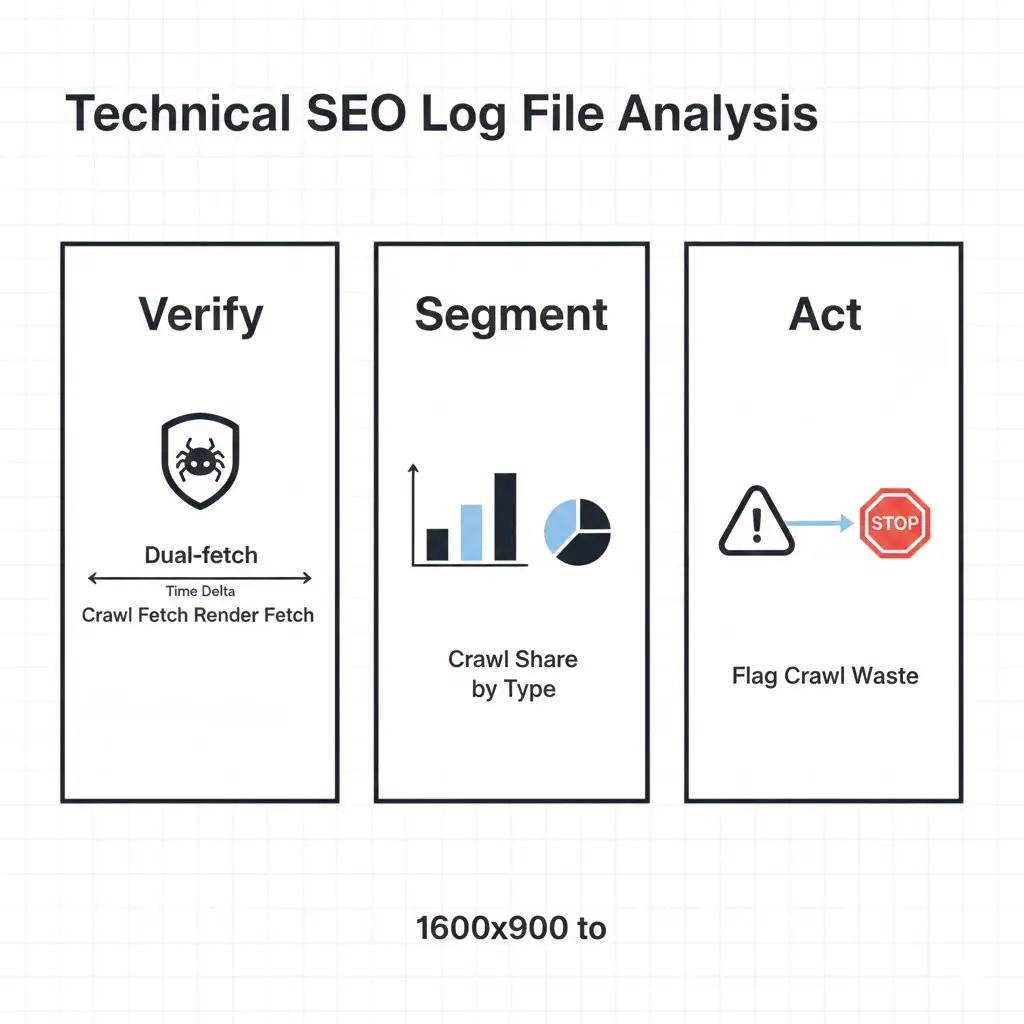
Dual-Fetch Render Detection via Logs
The rendering pipeline produces a distinctive log signature when Googlebot processes a JavaScript-heavy page. Understanding this signature is the basis for log-level rendering latency measurement.
Identifying Dual-Fetch Patterns
When Googlebot crawls a page that requires JavaScript rendering, it generates two log entries for the same URL: the initial crawl fetch (user agent Googlebot/2.1) and a subsequent render-fetch triggered by the rendering queue. The render-fetch user agent includes additional identifiers related to the headless Chromium environment — typically a longer user agent string containing Chrome version information alongside the Googlebot identifier.
The timestamp delta between the crawl fetch and the render fetch is the rendering latency for that URL. Extract this delta for each URL that generates dual-fetch entries in the log dataset. Build a rendering latency distribution: what percentage of canonical content pages are rendered within 24 hours? Within one week? Beyond one week?
On well-optimized sites with server-side rendered HTML, dual-fetch activity is minimal — Googlebot does not need to invoke the rendering queue for pages that deliver full HTML at crawl time. High dual-fetch volume across canonical content pages indicates a rendering architecture that depends on client-side JavaScript for content delivery — a structural risk detailed in the rendering architecture framework.
Rendering Latency by URL Type
Segment rendering latency by URL type to identify which templates are generating the longest rendering delays. Parameter variant URLs and faceted combinations that consume crawl budget frequently also consume rendering queue capacity — even non-indexable URLs that are crawled require rendering queue processing if they contain JavaScript. Blocking these URLs from crawl at the robots.txt layer eliminates their rendering queue load entirely, improving rendering throughput for canonical content pages.
The interaction between crawl waste reduction and rendering queue improvement is direct and measurable. Reducing crawl waste by 30% on a large catalog site typically produces a 25–40% improvement in rendering latency for canonical content pages, as the rendering queue is no longer processing waste URLs alongside revenue-critical pages.
Log-Based Indexation Signal Detection
Beyond crawl frequency and rendering latency, log data contains indexation signals that GSC does not surface directly. Two patterns are particularly diagnostic.
Crawl Without Index Correlation
Cross-reference the list of URLs crawled by Googlebot in the analysis window against the list of URLs included in Google’s index (extractable via the site: operator sampling or GSC Coverage export). URLs crawled frequently but not indexed — appearing in the “Crawled — currently not indexed” GSC state — are experiencing indexation suppression. The log data provides the crawl frequency context: a URL crawled daily but not indexed indicates a quality or directive signal problem, not a crawl budget problem. A URL crawled once in 30 days and not indexed may simply need higher crawl priority through depth flattening and internal link reinforcement.
This distinction matters for remediation prioritization. High-frequency crawled but not indexed URLs require content quality or directive investigation. Low-frequency crawled but not indexed URLs require crawl depth and internal link intervention. Log data is the tool that separates these two populations; GSC Coverage alone cannot distinguish between them. For the complete indexation control framework, see our guide on technical SEO indexation control.
Response Code Distribution Analysis
Extract the full HTTP response code distribution for all Googlebot requests in the analysis window. The healthy distribution pattern: 95%+ of requests return 200; 3–5% return 301 (expected redirect chains); under 1% return 404 or 410; under 0.1% return 500.
Deviations from this pattern are diagnostic flags. High 301 volume indicates redirect chain depth issues — Googlebot following multi-hop redirect chains wastes crawl allocation and may not pass full equity to the final destination. Elevated 404 volume indicates orphaned URL accumulation — legacy URLs still in Google’s crawl queue returning not-found responses. High 500 volume indicates server instability under Googlebot crawl load — a crawl rate suppression risk. Elevated soft-404 volume (200 responses with near-zero response body size) requires content-level investigation per the soft-404 control framework.
Log Analysis Integration with Technical SEO Systems
Log analysis is not a standalone diagnostic — it is the measurement layer that validates the effectiveness of every other technical SEO system. Its integration with adjacent frameworks is operational, not theoretical.
| Technical SEO System | Log Analysis Integration Point | Log Signal Used | Validation Trigger |
|---|---|---|---|
| Technical SEO Architecture | Validates URL generation and crawl path decisions | Crawl share by URL type; depth distribution | Monthly; post-template deployment |
| Crawl Budget Optimization | Measures waste reduction and reallocation outcomes | Parameter and facet crawl share; canonical content share | Monthly during active optimization; quarterly at steady state |
| Technical SEO Audit | Provides orphan detection, crawl trap identification, and directive failure data | Dual-fetch patterns; crawl-without-index URLs; response code anomalies | Quarterly audit cycle; post-migration |
| Technical SEO Checklist | Confirms deployment guardrail compliance via crawl behavior change | Crawl frequency shift post-deployment; directive change propagation timing | Post-deployment within 48 hours; 14-day follow-up |
| Implementation Mistakes Reference | Identifies log patterns matching documented failure modes | Parameter waste ratios; orphan crawl traps; redirect chain depth | Pre-remediation diagnosis; post-incident root cause analysis |
The integration point with the technical SEO audit is particularly important for ongoing governance. Log data provides the crawl-level evidence that the audit uses to classify architectural failures — without log data, the audit operates at the URL level and cannot detect systemic template-level crawl waste patterns. Together, they form the complete diagnostic system.
Monitoring Cadence and Alerting Model
Log analysis produces its highest diagnostic value when run consistently on a defined schedule, not reactively after rankings deteriorate. A monitoring cadence appropriate for most enterprise sites:
Monthly: full crawl share segmentation model run across the 30-day window. Compare against previous month’s baseline. Flag any category where share has shifted more than 5 percentage points without a corresponding deployment event — unexplained shifts indicate emerging crawl waste or crawl architecture drift.
Post-deployment (within 48–72 hours): targeted log pull for the URL patterns affected by the deployment. Verify crawl frequency and response code distribution for modified templates. Any 500 response spike, unexpected crawl gap, or anomalous redirect chain increase triggers immediate rollback evaluation.
Post-optimization (30 and 60 days): measure crawl share redistribution following directive implementation. The 30-day mark provides early signal; the 60-day mark provides the stable distribution for final validation. Both timeframes should show progressive improvement in canonical content crawl share relative to the pre-optimization baseline.
Quarterly: full rendering latency analysis. Segment dual-fetch patterns by URL type. Compare rendering queue throughput against the previous quarter. Any degradation in rendering latency for canonical content pages — without a corresponding increase in crawl volume — indicates rendering queue competition from non-canonical URL types that have evaded previous waste reduction efforts.
Frequently Asked Questions
What is the minimum log analysis window for reliable crawl frequency data?
Thirty days is the minimum viable window for crawl frequency distribution modeling. Shorter windows — 7 or 14 days — miss low-frequency crawl patterns and produce frequency bucket distributions skewed toward “once” and “never” for URLs that Googlebot crawls on a three to four week cycle. For large sites with complex faceted navigation or extensive parameter proliferation, 60 days provides more reliable waste ratio measurements because it captures multiple crawl cycle repetitions for the same waste URL patterns.
How do you distinguish a render-fetch from an initial crawl fetch in log data?
The user agent string is the primary distinguishing field. Initial crawl fetches use the standard Googlebot/2.1 user agent. Render-fetches use a longer user agent string that includes both the Googlebot identifier and a Chrome version reference — reflecting the headless Chromium environment used for JavaScript rendering. The exact string format has changed across Chrome versions, so pattern-match on both the Googlebot identifier and the Chrome version substring rather than matching the full string exactly. Secondary signal: render-fetches for the same URL arrive after the initial crawl fetch with a delay ranging from minutes to weeks, while initial crawl fetches have no prior entry for that URL in the recent log window.
What does a healthy crawl share distribution look like for a large e-commerce site?
On a well-optimized large catalog site, canonical content pages — product pages, category pages, editorial content — should represent 60–70% of total verified Googlebot requests. Infrastructure URLs (sitemaps, robots.txt, feeds) typically consume 3–5%. Intentionally indexed faceted filters add another 5–10% if the site has a large approved facet set. The remaining budget — ideally under 20% total — distributes across minimal residual parameter variants and paginated archives. Any site where non-indexable URL types collectively exceed 40% of Googlebot requests has significant architectural waste requiring intervention before content or link investment will compound effectively.
Can log data identify which specific templates are generating crawl waste?
Yes — template identification is one of the highest-value applications of log analysis. Group crawled URLs by URL pattern using regex classification that maps URL structures to known template types. For example, /products/[slug]/ maps to the product template; /category/[facet]/ maps to the faceted filter template. Calculate crawl share per template pattern. Any template pattern consuming disproportionate crawl allocation relative to its canonical URL count — more requests than canonical URLs would justify — is generating duplicate or waste URL variants at the template level. This pinpoints which templates require directive remediation in the engineering backlog. For the complete technical SEO checklist covering template-level directives, see our technical SEO checklist.
How quickly do crawl share improvements appear in log data after implementing robots.txt disallows or canonical tags?
Robots.txt disallow rules take effect at the next Googlebot crawl of the robots.txt file, which typically occurs within 24–48 hours on active sites. Crawl requests to disallowed patterns cease almost immediately after the rule propagates. Canonical tag effects on crawl allocation are slower — canonicalized URLs remain crawlable, and Googlebot continues visiting them at reduced frequency over a 4–8 week window before reallocating those request cycles to canonical targets. The 30-day post-implementation log pull provides early signal; the 60-day pull provides the stable redistribution baseline for final measurement.